| 600 |
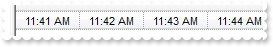
How can I display minutes
|
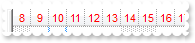
| 599 |
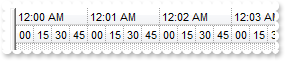
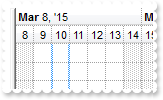
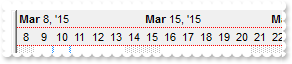
How can I display seconds, from 15 to 15
|
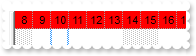
| 598 |
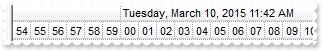
How can I display seconds
|
| 597 |
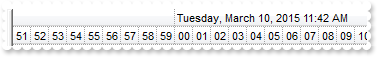
How can I display seconds
|
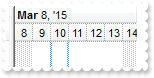
| 596 |
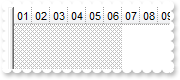
How can I align the text being shown in the chart's header
|
| 595 |
How can I hide the tooltip being displayed in the chart's header
|
| 594 |
How can I change the tooltip being displayed in the chart's header
|
| 593 |
How can I change the visual appearance of the chart's header, where levels are displayed, using your EBN files
|
| 592 |
How can I change the level's foreground color in the chart
|
| 591 |
How can I change the level's background color in the chart
|
| 590 |
How can I save data on XML format
|
| 589 |
How can I load data on XML format
|
| 588 |
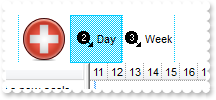
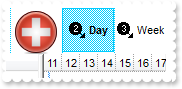
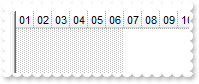
How can I add icons or pictures to the scale or zoom area
|
| 587 |
How can I add icons or pictures to the scale or zoom area
|
| 586 |
How can I change the width of the unit in the scale or zoom
|
| 585 |
How can I a scale or zoom of the chart, when right clicking the chart's header
|
| 584 |
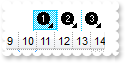
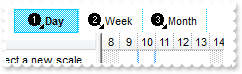
How can I a customize the scale or zoom of the chart
|
| 583 |
How can I a scale or zoom the chart at runtime
|
| 582 |
How can I a scale or zoom the chart at runtime
|
| 581 |
How can I a programmatically select a date
With G2antt1 .Chart.MarkSelectDateColor = RGB(255,0,0) .Chart.SelectLevel = 0 .Chart.FirstVisibleDate = #1/1/2001# .Chart.SelectDate(#1/2/2001#) = True .Chart.SelectDate(#1/5/2001#) = True End With |
| 580 |
How can I change the color to select a date, when clicking the chart's header
With G2antt1 .Chart.BackColor = RGB(255,255,255) .Chart.MarkSelectDateColor = RGB(255,0,0) End With |
| 579 |
How can I enable or disable selecting a date, when clicking the chart's header
With G2antt1 .Chart.BackColor = RGB(255,255,255) .Chart.MarkSelectDateColor = RGB(255,255,255) End With |
| 578 |
How can I specify the color or the stype for non working hours
|
| 577 |
How can I specify the pattern or the stype for non working hours
|
| 576 |
How can I specify the non working hours
|
| 575 |
How can I get the index of the level from the point or cursor
|
| 574 |
How can I get the link from the point or cursor
|
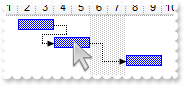
| 573 |
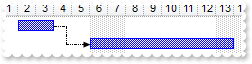
How can I disable or enable at runtime linking the bars
With G2antt1 .Chart.AllowLinkBars = True .Chart.FirstVisibleDate = #1/1/2001# .Columns.Add "Column" With .Items .AddBar .AddItem("Item 1"),"Task",#1/2/2001#,#1/4/2001#,"B1" .AddBar .AddItem("Item 2"),"Task",#1/6/2001#,#1/14/2001#,"B2" End With End With |
| 572 |
How can I check or verify if a date is a non working day
|
| 571 |
How can I check or verify if a date fits the chart's visible area
|
| 570 |
How can I add a remove all non working days
|
| 569 |
How can I add a remove a non working days
|
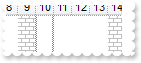
| 568 |
How can I add a custom non working days
|
| 567 |
How can hide the non working days
With G2antt1 .Chart.ShowNonworkingDates = False End With |
| 566 |
How can hide the non working days
With G2antt1 .Chart.NonworkingDays = 0 End With |
| 565 |
How can I let user adds new bars at runtime
With G2antt1 .Chart.AllowCreateBar = 1 .Columns.Add "Column" With .Items .AddItem "Item 1" .AddItem "Item 2" End With End With |
| 564 |
How can I change the width of the links between bars
|
| 563 |
How can I change the style for the links between bars
|
| 562 |
How can I change the color for the links between bars
|
| 561 |
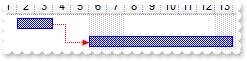
How can I hide the links between bars
With G2antt1 .Chart.FirstVisibleDate = #1/1/2001# .Columns.Add "Column" With .Items .AddBar .AddItem("Item 1"),"Task",#1/2/2001#,#1/4/2001#,"B1" .AddBar .AddItem("Item 2"),"Task",#1/6/2001#,#1/14/2001#,"B2" .AddLink "L1",.FindItem("Item 1",0),"B1",.FindItem("Item 2",0),"B2" End With .Chart.ShowLinks = False End With |
| 560 |
How can I display some grid line in the overview area
|
| 559 |
How do I change the tooltip when the cursor hovers the overview area
With G2antt1 .Chart.OverviewVisible = 2 .Chart.OverviewToolTip = "Tooltip on the overview" .Chart.FirstVisibleDate = #1/1/2001# .Columns.Add "Column" With .Items .AddBar .AddItem("Item 1"),"Task",#1/2/2001#,#1/4/2001# .AddBar .AddItem("Item 1"),"Task",#1/6/2001#,#1/14/2001# End With End With |
| 558 |
How do I remove the tooltip when the cursor hovers the overview area
With G2antt1 .Chart.OverviewVisible = 2 .Chart.OverviewToolTip = "" .Chart.FirstVisibleDate = #1/1/2001# .Columns.Add "Column" With .Items .AddBar .AddItem("Item 1"),"Task",#1/2/2001#,#1/4/2001# End With End With |
| 557 |
How do I change the selection color in the overview area
With G2antt1 .Chart.OverviewVisible = 2 .Chart.OverviewSelBackColor = RGB(255,0,0) .Chart.FirstVisibleDate = #1/1/2001# .Columns.Add "Column" With .Items .AddBar .AddItem("Item 1"),"Task",#1/2/2001#,#1/4/2001# End With End With |
| 556 |
How do I change the background color for the overview area
With G2antt1 .Chart.OverviewVisible = 2 .Chart.OverviewBackColor = RGB(255,0,0) .Chart.FirstVisibleDate = #1/1/2001# .Columns.Add "Column" With .Items .AddBar .AddItem("Item 1"),"Task",#1/2/2001#,#1/4/2001# End With End With |
| 555 |
How do I specify the height for the overview area
With G2antt1 .Chart.OverviewVisible = 2 .Chart.OverviewHeight = 16 .Chart.FirstVisibleDate = #1/1/2001# .Columns.Add "Column" With .Items .AddBar .AddItem("Item 1"),"Task",#1/2/2001#,#1/4/2001# End With End With |
| 554 |
How do I show or hide the control's overview area
|
| 553 |
How do I enable or disable resizing the bars at runtime
With G2antt1 .Chart.BarsAllowSizing = False End With |
| 552 |
How do I get the bar from the point or cursor
|
| 551 |
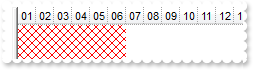
How do I specify the color of pattern for non working days
With G2antt1 .Chart.NonworkingDays = 66 .Chart.NonworkingDaysPattern = 8 .Chart.NonworkingDaysColor = RGB(255,0,0) End With |
| 550 |
How do I specify the type of pattern for non working days
|
| 549 |
How do I specify the non working days
|
| 548 |
How do I specify the non working days
|
| 547 |
How do I add a predefined bar
|
| 546 |
How do I change the unit being displayed in the chart
With G2antt1 .Chart.PaneWidth(False) = 0 .Chart.UnitScale = 256 .Chart.UnitWidth = 64 End With |
| 545 |
How do I specify the prodefined tooltip being shown on the chart's header, when Zoom method is used
|
| 544 |
How do I specify the prodefined labels being displayed on the chart, when Zoom method is used
|
| 543 |
How do I scale or zoom the chart to a specified range of date
|
| 542 |
How do I scale or zoom the chart to a specified range of date
|
| 541 |
How do I find the next date or previous date
|
| 540 |
How can I change the color for the grid lines in the chart
|
| 539 |
How can I draw, show or hide the grid lines in the chart
|
| 538 |
How do I change the color to highlight the today in the chart
With G2antt1 .Chart.MarkTodayColor = RGB(255,0,0) End With |
| 537 |
How do I hide or stop highlighting the today area in the chart
With G2antt1 With .Chart .MarkTodayColor = .BackColor End With End With |
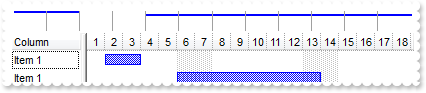
| 536 |
Is there any function to get the date in the format that I use for levels, to layout my chart's header
|
| 535 |
How can I get the date from the point, cursor
' MouseMove event - Occurs when the user moves the mouse. Private Sub G2antt1_MouseMove(ByVal Button As Integer, ByVal Shift As Integer, ByVal X As Long, ByVal Y As Long) With G2antt1 Debug.Print( .Chart.DateFromPoint(-1,-1) ) End With End Sub |
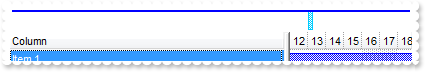
| 534 |
How can I show or hide the small ticker that shows up when the cursor hovers the chart area
With G2antt1 .Chart.DrawDateTicker = True End With |
| 533 |
How can I change the first visible date in the chart
|
| 532 |
How can I scroll or ensure that a specified date time is visible in the chart
|
| 531 |
How can I scroll or ensure that a specified date time is visible to the right side of the chart or control
|
| 530 |
How can I scroll or ensure that a specified date time is visible
|
| 529 |
How can I show or hide the the tooltip being shown when the user scrolls the chart
|
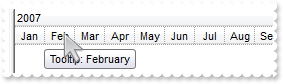
| 528 |
How can I change the format of the tooltip when the user scrolls the chart
|
| 527 |
How can I hide the chart's scroll bar
With G2antt1 .Chart.ScrollBar = False End With |
| 526 |
How can I specify the first day of the week
|
| 525 |
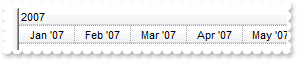
How do I change the AM or PM shortcuts in the chart's header
|
| 524 |
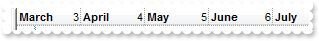
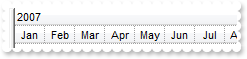
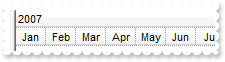
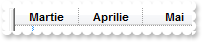
How do I change the name for the months, being displayed in the chart's header
|
| 523 |
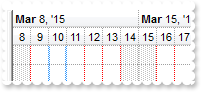
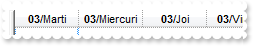
How do I change the name for the week days, being displayed in the chart's header
|
| 522 |
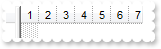
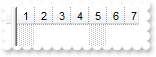
How do I access a level in the chart's header
|
| 521 |
How can I change the color for the grid lines between the leves in the chart's header
With G2antt1 .GridLineColor = RGB(255,0,0) .Chart.LevelCount = 2 End With |
| 520 |
How can I show or hide the grid lines between the leves in the chart's header
|
| 519 |
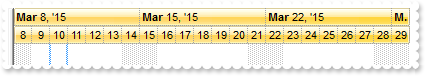
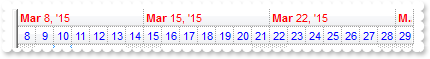
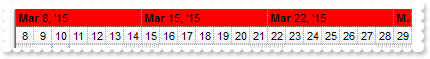
How do I change the foreground color for the chart's header
|
| 518 |
How do I change the background color for the chart's header
|
| 517 |
How do I specify the chart's foreground color
With G2antt1 .Chart.ForeColor = RGB(255,0,0) End With |
| 516 |
How do I specify the chart's background color
With G2antt1 .Chart.BackColor = RGB(255,0,0) End With |
| 515 |
How do I put a picture on the center of the chart
With G2antt1 .Chart.Picture = G2antt1.ExecuteTemplate("loadpicture(`c:\exontrol\images\zipdisk.gif`)") .Chart.PictureDisplay = 17 End With |
| 514 |
How do I resize/stretch a picture on the chart's background
With G2antt1 .Chart.Picture = G2antt1.ExecuteTemplate("loadpicture(`c:\exontrol\images\zipdisk.gif`)") .Chart.PictureDisplay = 49 End With |
| 513 |
How do I put a picture on the chart's center right bottom side
With G2antt1 .Chart.Picture = G2antt1.ExecuteTemplate("loadpicture(`c:\exontrol\images\zipdisk.gif`)") .Chart.PictureDisplay = 34 End With |
| 512 |
How do I put a picture on the chart's center left bottom side
With G2antt1 .Chart.Picture = G2antt1.ExecuteTemplate("loadpicture(`c:\exontrol\images\zipdisk.gif`)") .Chart.PictureDisplay = 32 End With |
| 511 |
How do I put a picture on the chart's center top side
With G2antt1 .Chart.Picture = G2antt1.ExecuteTemplate("loadpicture(`c:\exontrol\images\zipdisk.gif`)") .Chart.PictureDisplay = 1 End With |
| 510 |
How do I put a picture on the chart's right top corner
With G2antt1 .Chart.Picture = G2antt1.ExecuteTemplate("loadpicture(`c:\exontrol\images\zipdisk.gif`)") .Chart.PictureDisplay = 2 End With |
| 509 |
How do I put a picture on the chart's left top corner
With G2antt1 .Chart.Picture = G2antt1.ExecuteTemplate("loadpicture(`c:\exontrol\images\zipdisk.gif`)") .Chart.PictureDisplay = 0 End With |
| 508 |
How do I put a picture on the chart's background
|
| 507 |
How to specify the width for the left or side pane
With G2antt1 .Chart.PaneWidth(False) = 128 End With |
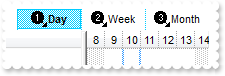
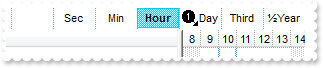
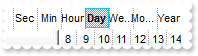
| 506 |
How do I display the header of the chart using multiple levels, lines
|
| 505 |
How do change the width of the chart's area
With G2antt1 .Chart.PaneWidth(True) = 256 End With |
| 504 |
How do I show or hide the control's chart area
With G2antt1 .Chart.PaneWidth(True) = 0 End With |
| 503 |
How do I access the chart's area of the control
|
| 502 |
How can I select a cells like in excel
With G2antt1 .SingleSel = False .FullRowSelect = 1 .MarkSearchColumn = False .SearchColumnIndex = -1 .Columns.Add "Column1" .Columns.Add "Column2" .Columns.Add "Column3" With .Items .DefaultItem = .AddItem(0) .CellValue(0,1) = 1 .CellValue(0,2) = 2 .DefaultItem = .AddItem(3) .CellValue(0,1) = 4 .CellValue(0,2) = 5 .DefaultItem = .AddItem(6) .CellValue(0,1) = 7 .CellValue(0,2) = 8 End With End With |
| 501 |
How can I select a multiple column
With G2antt1 .MarkSearchColumn = False .SingleSel = False .FullRowSelect = 1 .Columns.Add("Column1").Selected = True .Columns.Add "Column2" .Columns.Add("Column3").Selected = True With .Items .DefaultItem = .AddItem(0) .CellValue(0,1) = 1 .CellValue(0,2) = 2 .DefaultItem = .AddItem(3) .CellValue(0,1) = 4 .CellValue(0,2) = 5 .DefaultItem = .AddItem(6) .CellValue(0,1) = 7 .CellValue(0,2) = 8 End With .Items.SelectAll End With |